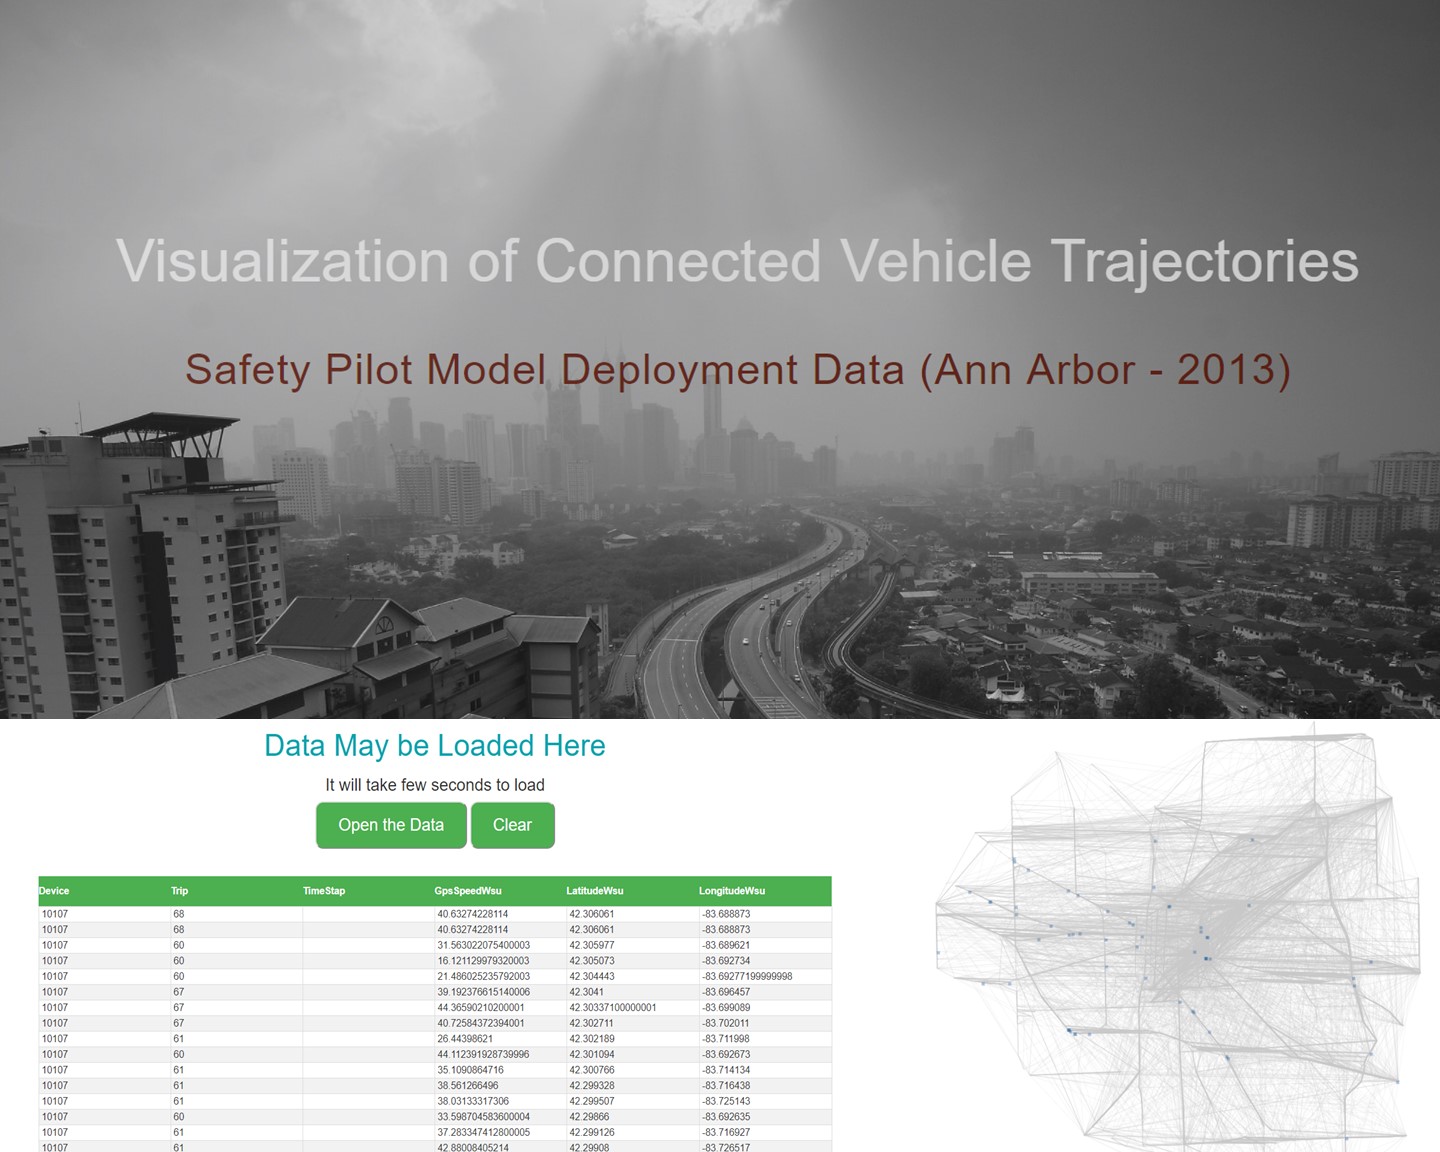
- Adaptive signal control technology (ASCT) is a system that dynamically and automatically adjusts signal timing parameters in real-time to optimize traffic operations of a corridor.
- We develop a stochastic model to ascertain the mobility effect of the ASCT on travel time reliability (TTR).
- TTR performance metrics based on the measure of variations (coefficient of variation) and index-based measures (buffer index, planning time index, and misery index) were used in the analysis.
- The stochastic model proposed is based on Bayesian additive regression, which its parameters are specified as distributions.
- Travel time data of a 3.3-mile corridor on Mayport highway in Jacksonville, Florida was used as the case study.
- For almost a century, several models have been developed to calibrate the pairwise relationship among traffic flow variables, i.e., speed, density, and flow.
- Multi-regime models are well known for being superior in fitting the speed-density relationship over single-regime models.
- However, in modeling multi-regimes models, breakpoints separating the regimes are generally estimated by a model developer based on the subjective judgment of visual data characteristics.
- A new calibration approach based on Bayesian inference is introduced for fitting the multi-regimes models.
- The superiority of the new calibration approach is the ability to locate the breakpoints in the multi-regime considering the specific data characteristics.
- Analytical models developed using field traffic data can be utilized with acceptable confidence to reliably represent, predict, and evaluate the operational characteristics of the highway systems.
- Establishing a model to estimate the stochastic evolution of traffic conditions is important for prediction and developing effective solution to address roadway congestion.
- Using a freeway segment of I-295 located in Jacksonville, Florida as a case study, an advanced statistical method developed in the Bayesian modeling framework was developed to account for the day of the week and lane lateral location disparities effect in influencing the dynamic evolution characteristics of traffic regimes.
- Specifically, this study applied the Markov Chain theory and random coefficients logistic regression model in the analysis.
- Mixture models belong to a family of semi-parametric model that are flexible in fitting data with heterogeneous characteristics.
- The Gaussian mixture model (GMM) was used to demonstrate its uses in clustering traffic congestion using data collected from a freeway.
- In the GMM, a regression model with the explanatory variable in the components’ proportions is incorporated.
- More specifically, the mixture-component weights are fitted with traffic occupancy to increase flexibility of the model. This model can also be referred to as the mixture models with varying mixing proportions.
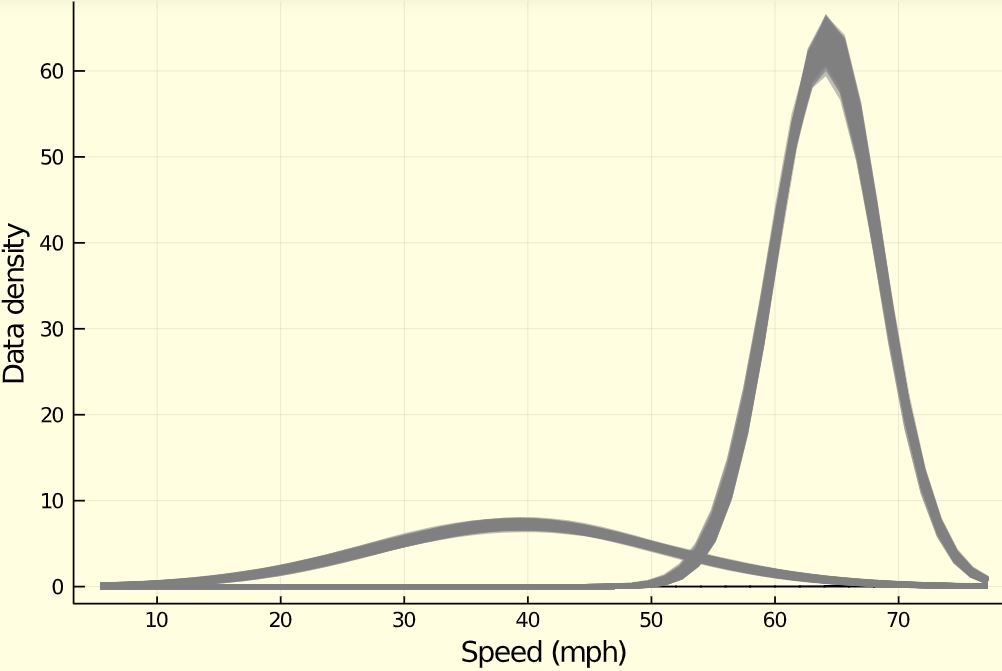
- A cluster analysis based on the Gaussian mixture algorthm is presented for estimating two components of travel speed distribution.
- These two components can be referred to as the slow moving component, congested regime and high speed component, free-flow regime.
Aug, 2020
Method: Data Analysis (Python, Pymc3)
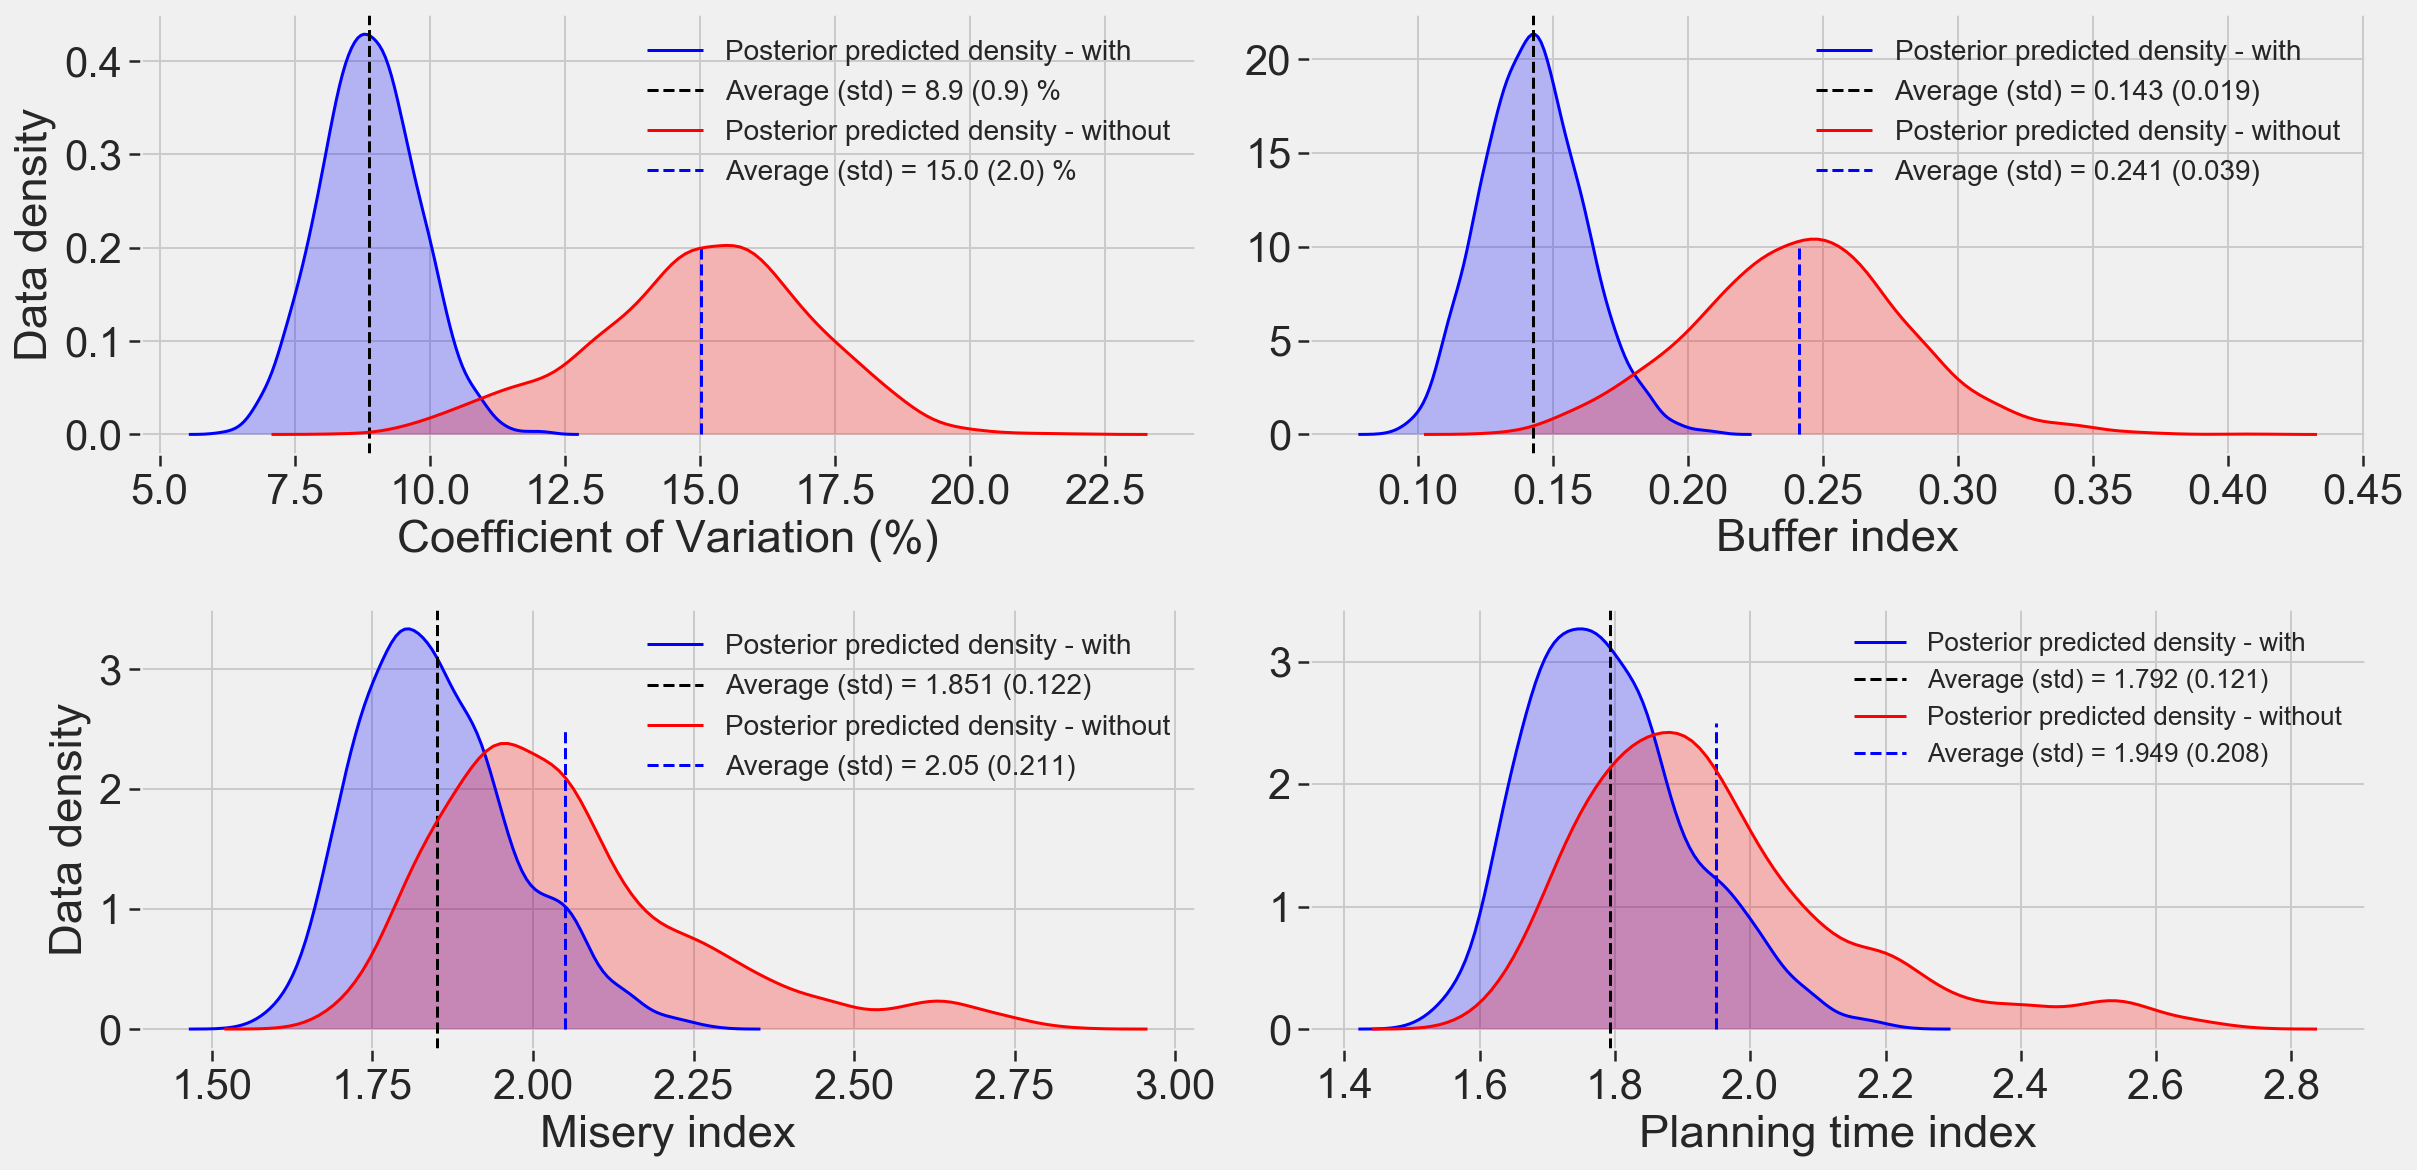
Comparison of posterior distributions of travel time reliability metrics with and without ASCT
July, 2020
Method: Data Analysis (Python, Numpyro)
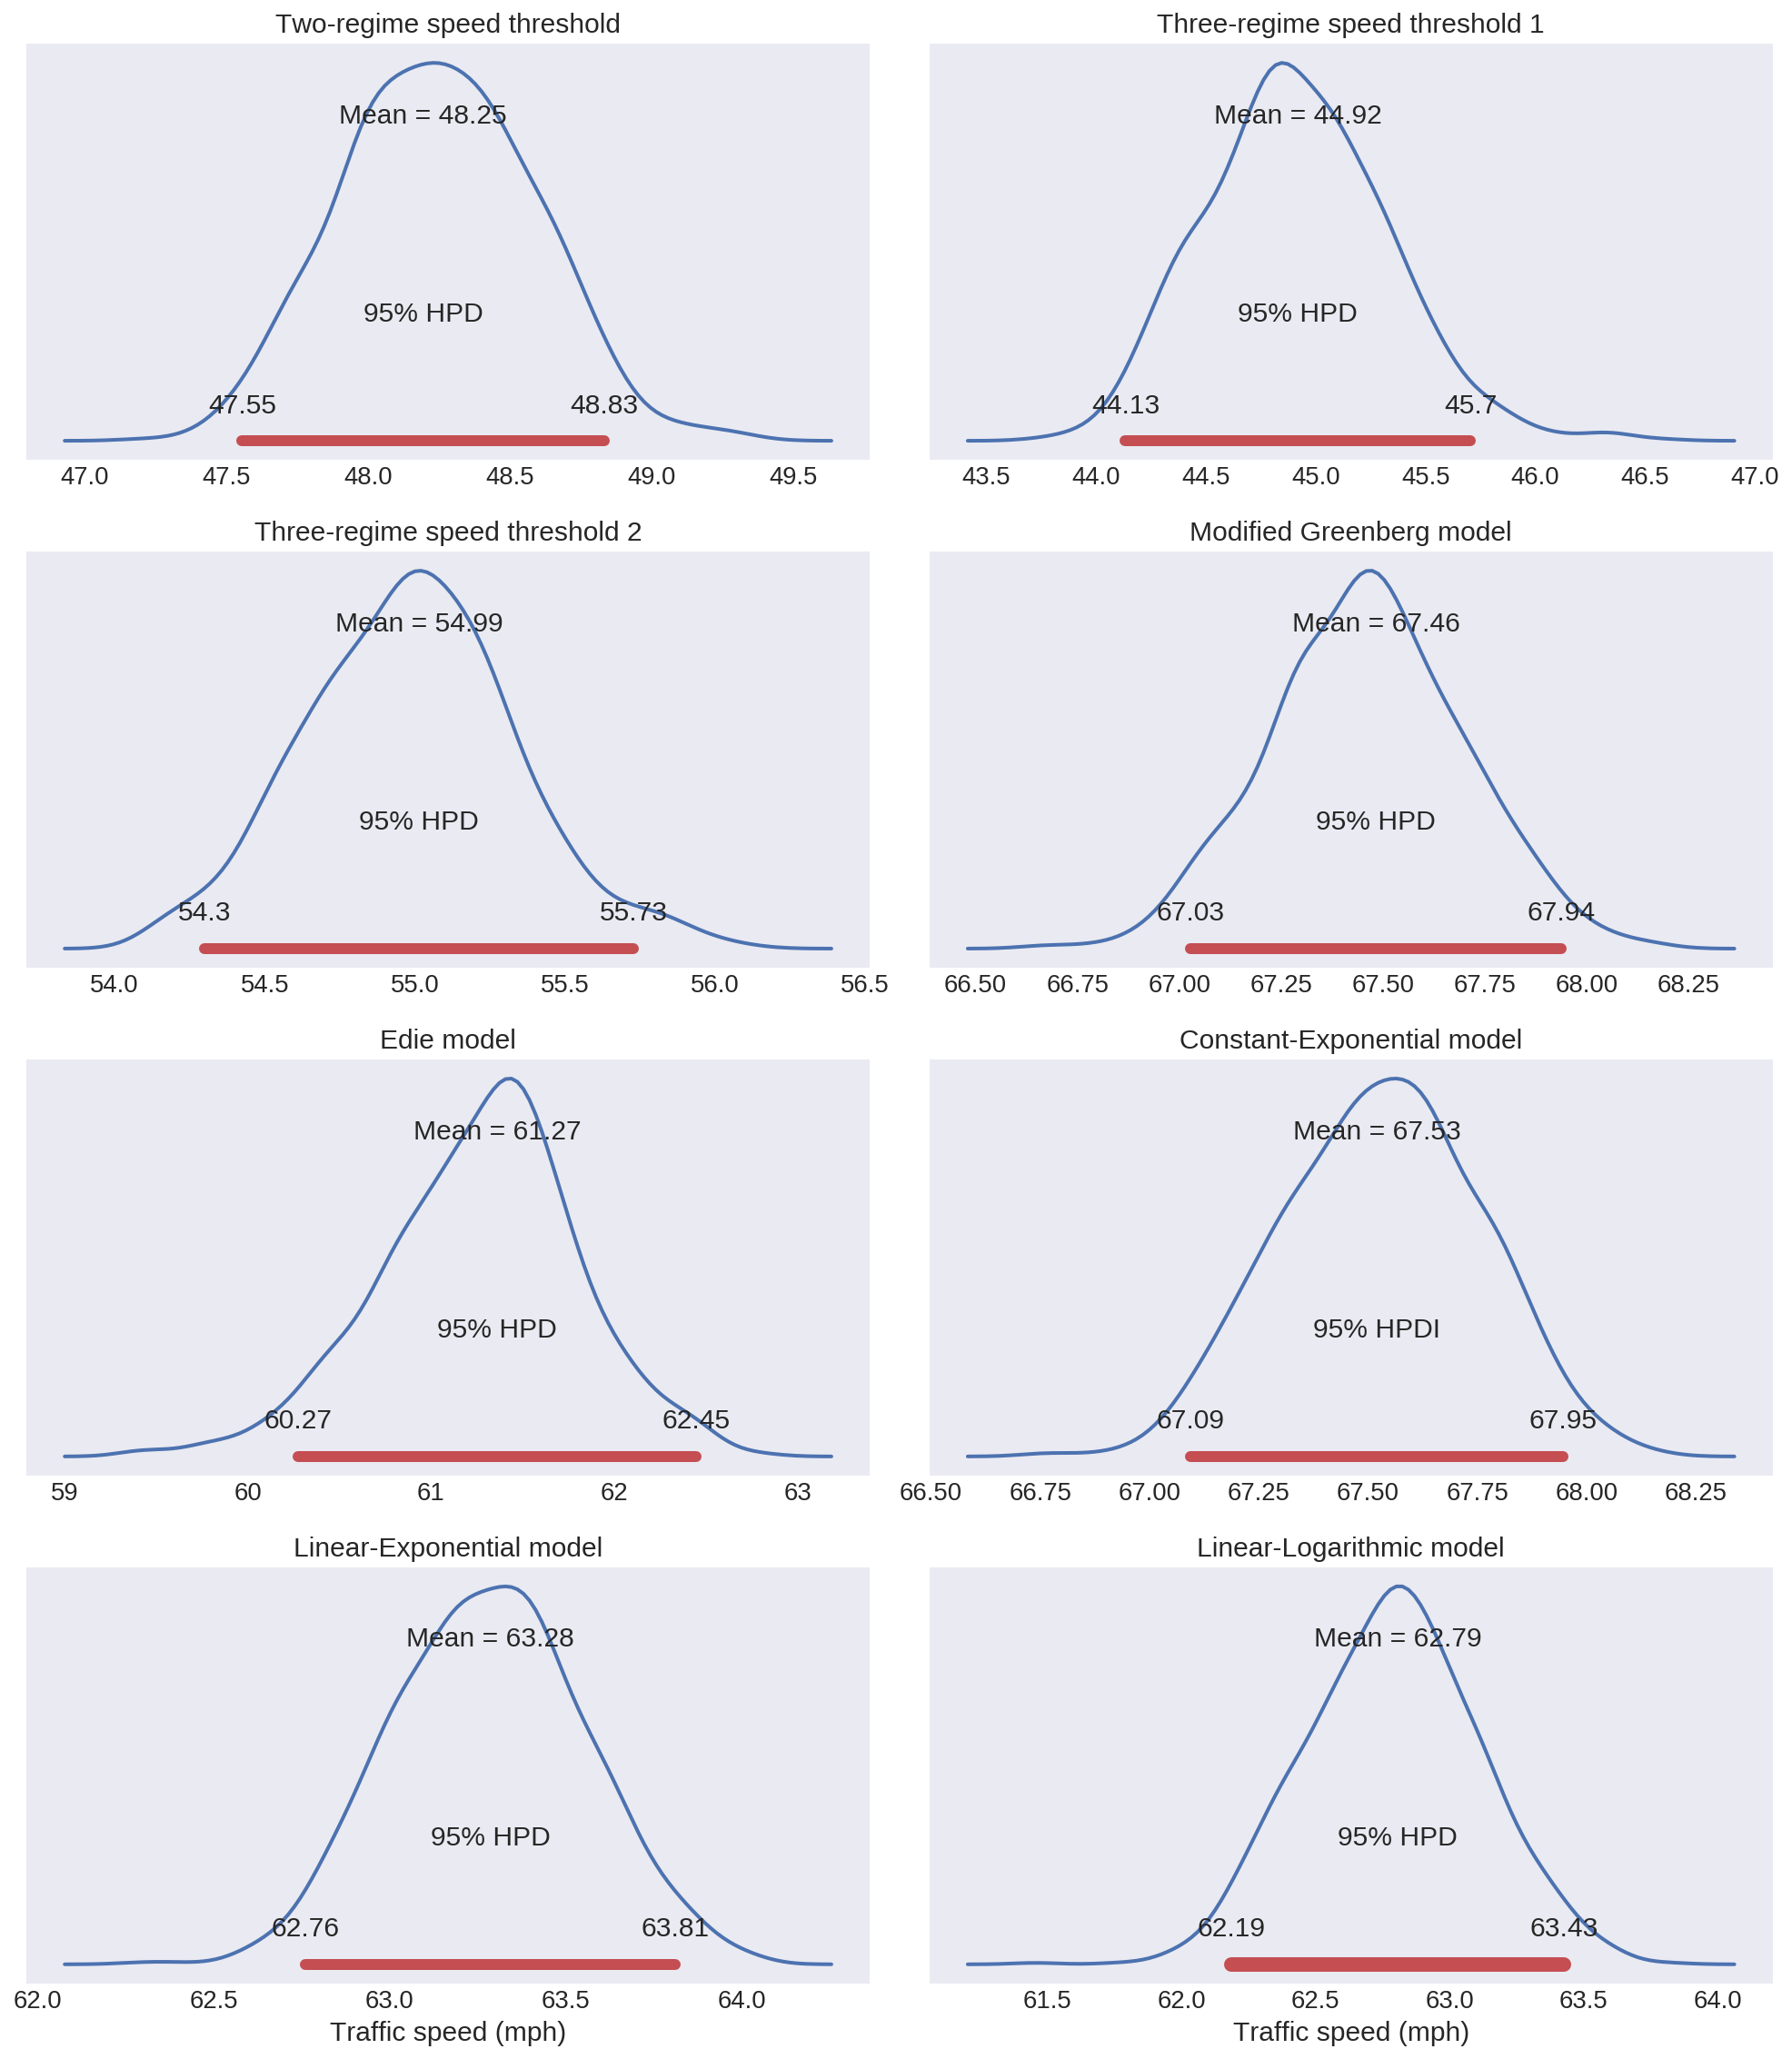
Posterior distribution of Change point Speed (mph) for different traffic flow models
June, 2020
Method: Data Analysis (Python, Pymc3)
Dynamic transition of traffic conditions described by the Markov Chains
May, 2020
Method: Data Analysis (Julia, Turing)
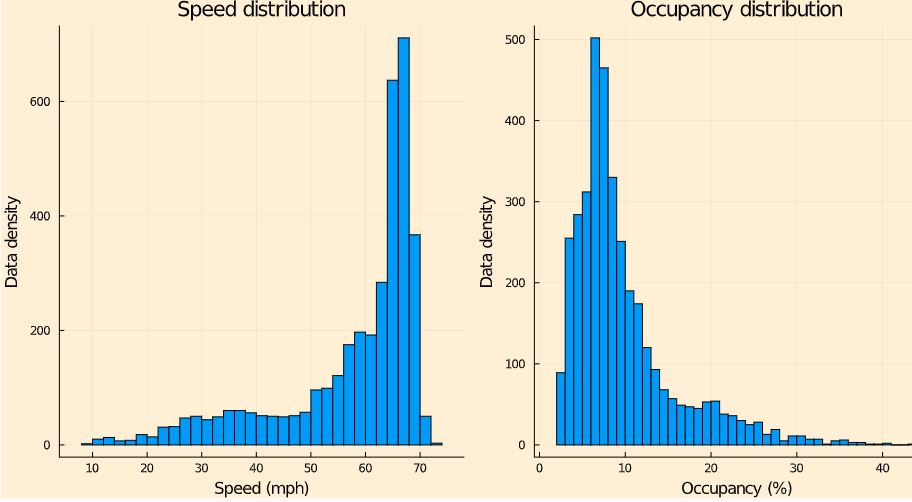
Travel speed and occupancy distribution retrieved from a freeway highway
April, 2020
Method: Data Analysis (Julia, Turing)
Predicted posterior distribution estimated using Markov Chain Monte Carlo simulations